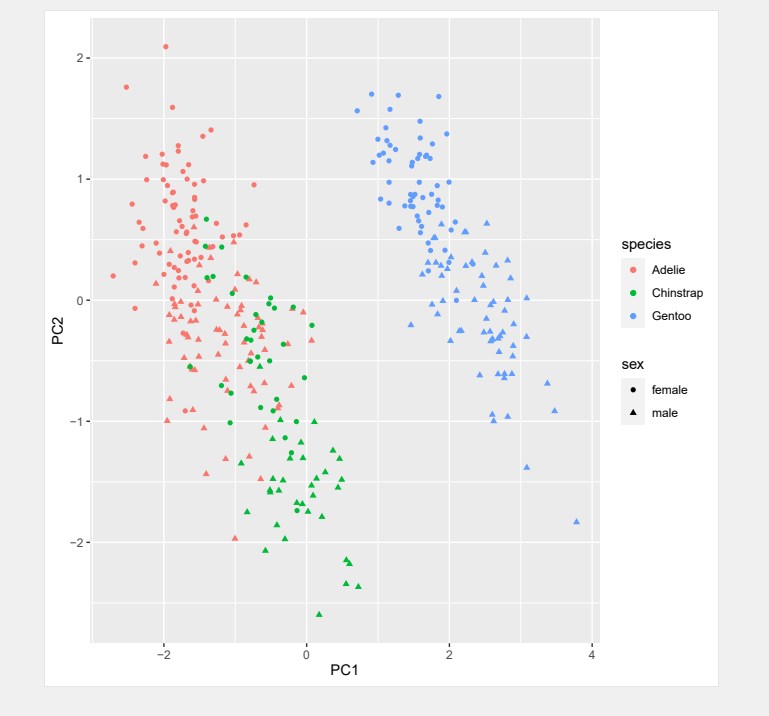
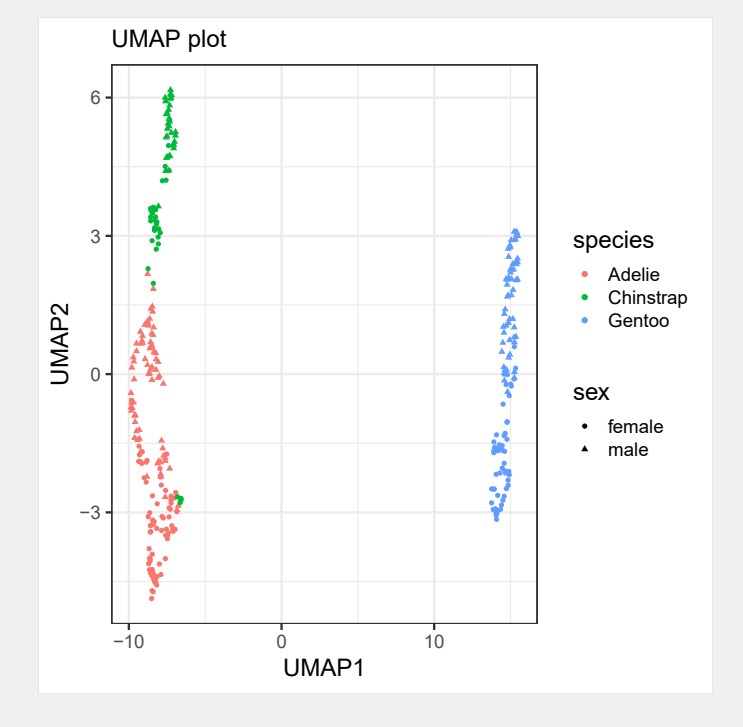
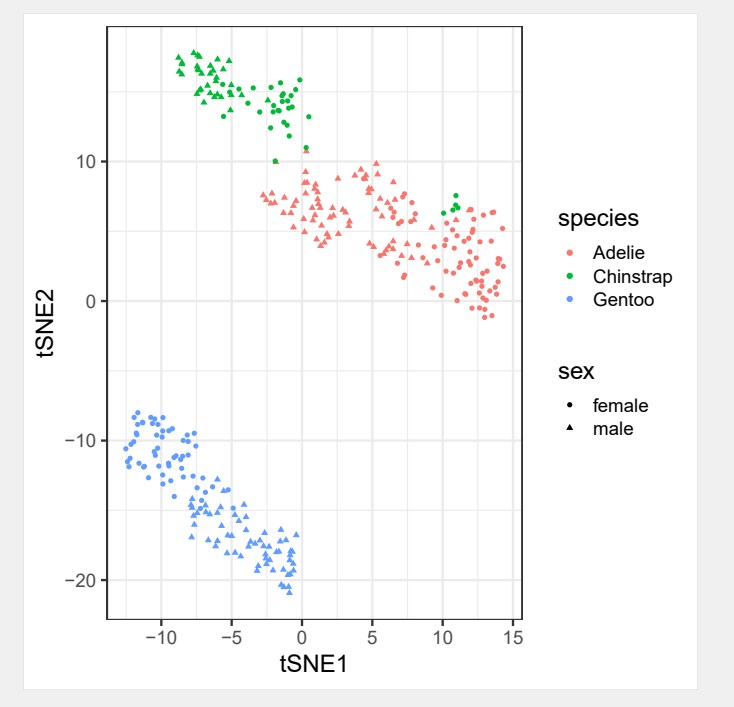
今天小果想利用PCA,UMAP和tSNE三种算法对同一数据进行降维分析,来比较一下三种方法的降维效果,小果将通过该推文为小伙伴们演示如何利用这三种分析方法进行降维分析,
有需要小伙伴可以跟着小果的步伐开始今天的学习之旅奥!
- 何为PCA,UMAP和tSNE分析?
PCA是最常用的线性降维方法,通过某种线性投影,将高维数据映射到低维的空间中表示,并期望在所投影的维度上数据的方差最大,以此使用较少的数据维度,同时保留住较多的原数据点的特性。t-SNE是一种非线性降维算法,非常适用于高维数据降维到2维或者3维,进行可视化,t-SNE具有两大优势,对于不相似的点,用一个较小的距离会产生较大的梯度来让这些点排斥开来,这种排斥又不会无限大,避免不相似的点距离太远。UMAP可以用于类似于t-SNE的可视化,但也可以用于一般的非线性降维,以上内容就是小果对这三种算法原理的简单介绍,接下来跟着小果开始今天的实操吧!
2.安装所需要的R 包
install.packages(“tidyverse”)
install.packages(“broom”)
install.packages(“umap”)
install.packages(“Rtsne”)
install.packages(“ggplot2”)
3.加载需要的R包
library(tidyverse)
library(broom)
library(umap)
library(Rtsne)
library(ggplot2)
- 读取数据
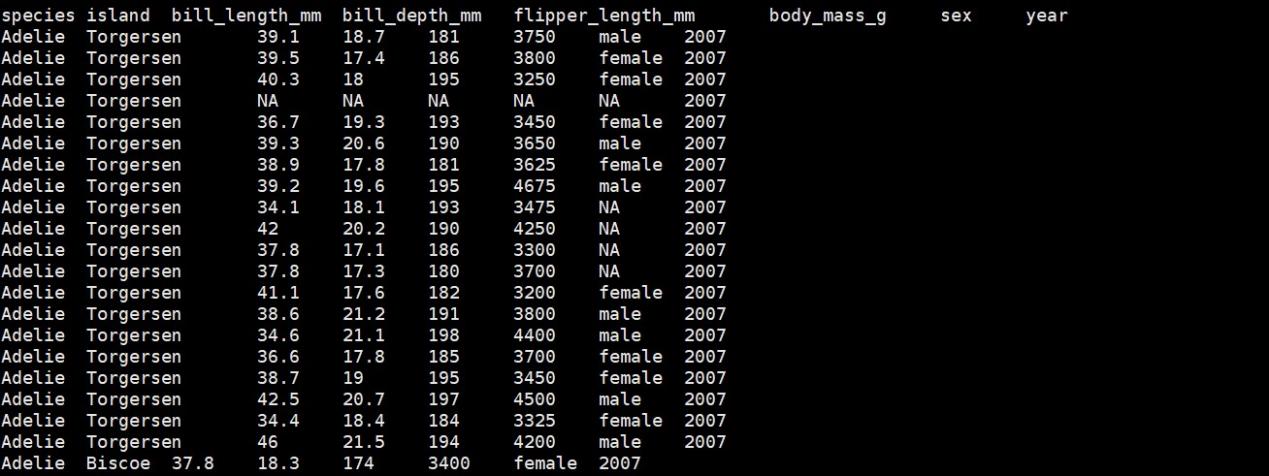
#数据类型包括字符串类型和数值型类型。
df<-read.table(“test.txt”,header=T)

5.#PCA降维分析
penguins <- df %>%
drop_na() %>% #删除缺失值
select(-year) #删除year这一列数据
#使用prcomp()进行PCA
#PCA前对数值型数据进行标准化
pca_fit <- penguins %>%
select(where(is.numeric)) %>% #选择数值型数据
scale() %>% #数据进行标准化
prcomp() #prcomp函数进行PCA分析
summary(pca_fit) #对PCA分析结果进行统计
pca_fit %>%
augment(penguins) %>%
rename_at(vars(starts_with(“.fitted”)),
list(~str_replace(.,”.fitted”,””))) %>%
ggplot(aes(x=PC1,
y=PC2,
color=species,
shape=sex))+
geom_point()+
labs(x = “PC1”,
y = “PC2”)
#保存图片
ggsave(“pca.pdf”)

6.#UMAP降维分析
library(umap)
theme_set(theme_bw(18))
penguins <- df%>%
drop_na() %>% #去除空值
select(-year)%>% #删除year列
mutate(ID=row_number()) #添加新的行名
penguins_meta <- penguins %>%
select(ID, species, island, sex) #筛选这三列信息
set.seed(142)
umap_fit <- penguins %>%
select(where(is.numeric)) %>% #选择数值型列数据
column_to_rownames(“ID”) %>% #将列名转化为行名
scale() %>% #将数据标准化
umap()
#提取UMAP降维数据
umap_df <- umap_fit$layout %>%
as.data.frame()%>% #将数据转化为数据框
rename(UMAP1=”V1″,#修改列名
UMAP2=”V2″) %>%
mutate(ID=row_number())%>% #添加新的行名
inner_join(penguins_meta, by=”ID”) #将两个数据进行内连接
umap_df %>% head()
#绘制UMAP降维散点图
umap_df %>%
ggplot(aes(x = UMAP1,
y = UMAP2,
color = species,
shape = sex))+
geom_point()+
labs(x = “UMAP1”,
y = “UMAP2”,
subtitle = “UMAP plot”)
ggsave(“uma.pdf”)

7.#tSNE降维分析
library(Rtsne)
theme_set(theme_bw(18))
penguins <- df %>%
drop_na() %>%
select(-year)%>%
mutate(ID=row_number())
penguins_meta <- penguins %>%
select(ID,species,island,sex)
set.seed(142)
tSNE_fit <- penguins %>%
select(where(is.numeric)) %>%#筛选数据类型是数值型的列
column_to_rownames(“ID”) %>% #将列ID数据转换为行名
scale() %>% #数据标准化
Rtsne() #进行tSNE分析
#提取tSNE降维数据
tSNE_df <- tSNE_fit$Y %>%
as.data.frame() %>% #将数据转化为数据框
rename(tSNE1=”V1″,
tSNE2=”V2″) %>% #修改列名
mutate(ID=row_number()) #添加新的一列
tSNE_df <- tSNE_df %>%
inner_join(penguins_meta, by=”ID”) #内连接,取共有的数据
tSNE_df %>% head()
#绘制tSNE降维散点图
tSNE_df %>%
ggplot(aes(x = tSNE1,
y = tSNE2,
color = species,
shape = sex))+
geom_point()+
theme(legend.position=”right”)
ggsave(“tSNE.pdf”)

最终小果利用三种算法进行了降维分析,不同算法产生的效果也不一致。如果小伙伴有其他数据分析需求,可以尝试使用本公司新开发的生信分析小工具云平台,零代码完成分析,非常方便奥,云平台网址为:http://www.biocloudservice.com/home.html,包括了绘制单细胞tSNE图(http://www.biocloudservice.com/229/229.php),pca图绘制(http://www.biocloudservice.com/443/443.php)等小工具,今天小果的分享就到这里,期待和大家一起讨论学习哈!!!!