我们都知道富集分析是一种广泛应用于生物信息学研究的统计方法,主要用于检验一个基因集合中某些功能或特征的富集程度,进而帮助我们解读一组基因背后所代表的生物学知识,并揭示其在细胞内或细胞外扮演了什么样的角色。当我们展示富集分析的结果的时候,有多种的表示方法,小果偶尔也想绘制一些新奇精彩的图片,所以特地学习了ggalluvial这个包,不但可以展示富集得到的基因,还可以将配体与受体的关系也一并绘制在图上!今天的数据处理量比较大,如果小伙伴们自己的服务器运行空间有限,欢迎订阅我们的服务器哦~
在教大家如何使用ggalluvial绘制冲积图之前,小果需要先给小伙伴们介绍一下,什么是GO富集分析(Gene Ontology Enrichment Analysis)。当我们获得一批转录组的数据后,必然要做的是不同样本之间的差异基因分析,在得到差异的基因或蛋白列表后,还会遇到一个问题,那就是差异基因是非常多的,需要有一种方法可以批量处理。
此时我们就需要把这些差异基因进行注释,把这些基因或蛋白分成几大类(一个类别就相当于一个GO term),此时只要判断这几个GO term的区别,就可以更容易地对大批量的数据进行分析了,而这个过程就是富集分析。富集分析属于差异基因的下游分析,常常涉及到两个概念,前景基因和背景基因,前景基因就是我们关注的重点研究的基因集,背景基因就是所有的基因集。
在了解了富集分析原理的基础上,我们就可以进行GO富集分析,并使用冲积图展示其独特的结果啦!
第一步:对所有背景基因的DEG(差异表达基因)进行GO分析
在已经辨明肿瘤簇与基质簇的基础上,依据小果提供的代码,导入dplyr,stats,ggplot2,gplots,RColorBrewer包。首先设定GO基因集为高等级的GO terms,接着过滤少于10个基因的基因集,筛选差异表达基因,并对一个基因集合进行GO富集分析,使用超几何分布检验来计算每个GO术语在每个细胞群中的富集程度,然后使用FDR(false discovery rate)方法来校正p值,并过滤掉所有FDR<0.01的基因,最后找到每簇的表达最高的20个基因组,绘制热图,将从数据中选择特定的生物过程运用完全链接进行聚类。
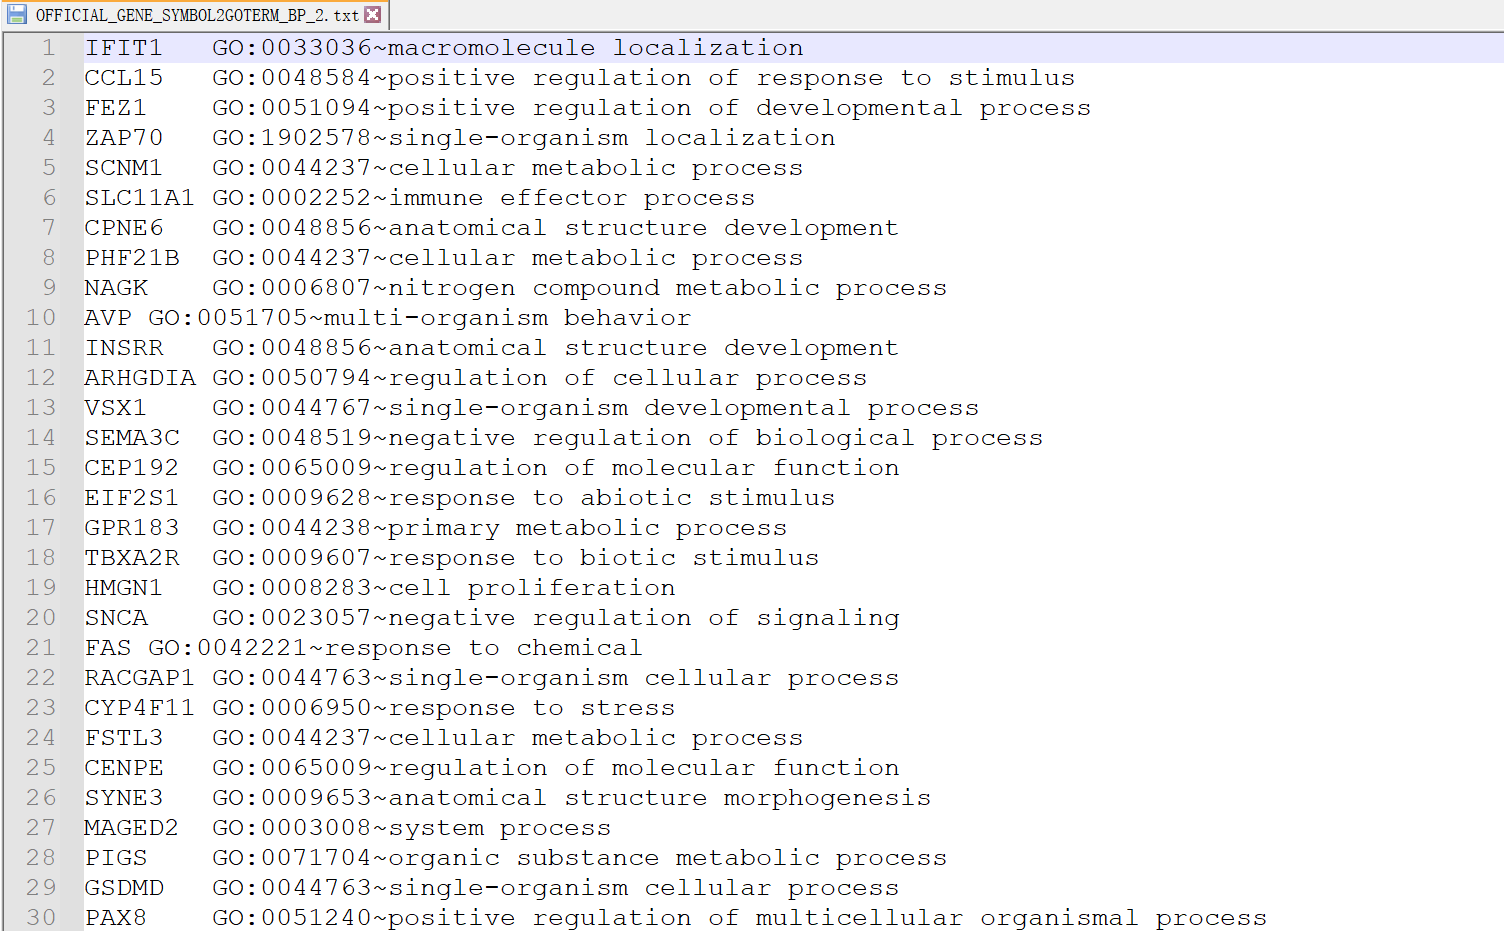
如图是我们的输入数据,包含了GO的分类集。
# 导入包
library(dplyr)
library(stats)
library(ggplot2)
library(gplots)
library(RColorBrewer)
data_dir = ‘/data’
save_dir = ‘/results’
fnm = paste0(save_dir,
‘/seurat_object_TM_SM.RData’)
load(fnm)
## 设定GO基因集为高等级的GO terms
read_and_merge <- function(data_dir, file_names) {
df <- tibble()
for (file_name in file_names) {
file_path <- glue(“{data_dir}/DAVIDKnowledgebase/{file_name}”)
df_temp <- read_tsv(file_path)
df <- rbind(df, df_temp)
}
return(df)
}
file_names <- c(“OFFICIAL_GENE_SYMBOL2GOTERM_BP_2.txt”,
“OFFICIAL_GENE_SYMBOL2GOTERM_BP_3.txt”,
“OFFICIAL_GENE_SYMBOL2GOTERM_BP_4.txt”)
df <- read_and_merge(data_dir, file_names)
GO <- unique(df$GO_term)
GO_set <- df %>%
group_by(GO_term) %>%
summarise(gene = toString(unique(gene)))
## 过滤少于10个基因的基因集
indx = c()
for (i in seq(1,dim(GO_set)[1])){
temp = GO_set[i,2][[1]]
x = strsplit(temp,’, ‘)
geneset = x[[1]]
if (length(geneset)>10){
indx = c(indx,i)
}
}
GO_set = GO_set[indx,]
GO_set = GO_set[!duplicated(GO_set), ] # remove duplicate
GO_set = GO_set[!is.na(GO_set$GO_term),] # remove NA
## 筛选差异表达基因
dir1 = paste0(save_dir,’/ST differentially expresssed genes up and down’)
files = list.files(dir1)
clusters = list()
clu_nm = c()
for (i in seq(1,length(files))){
fnm = files[i]
clu = unlist(strsplit(fnm,’.x’))[1]
tmp1 = read.table(paste0(dir1,’/’,fnm),header = TRUE, stringsAsFactors = F, check.names=F)
tmp1 = tmp1[tmp1$avg_logFC>0,]
tmp1 = tmp1[tmp1$p_val<0.01,]
clusters[[clu]] = list(tmp1$gene)
clu_nm = c(clu_nm,clu)
}
## 对一个基因集合进行GO富集分析,使用超几何分布检验来计算每个GO术语在每个细胞群中的富集程度,然后使用FDR(false discovery rate)方法来校正p值
enrich_matrix = data.frame(matrix(1, ncol = length(clusters), nrow = dim(GO_set)[1]))
colnames(enrich_matrix) = clu_nm
temp = as.character(GO_set$GO_term)
GO_names = c()
for (i in seq(1,dim(GO_set)[1])){
temp = GO_set[i,2][[1]]
x = strsplit(temp,’, ‘)
geneset = x[[1]]
temp = as.character(GO_set[i,1][[1]])
y = strsplit(temp,’~’)
go_name = y[[1]][2]
GO_names = c(GO_names,go_name)
for (j in seq(1,length(clusters))){
cluster_DE_genes = unlist(clusters[[j]])
N_ST = length(cluster_DE_genes)
N_geneset = length(geneset)
N_intersect = length(intersect(cluster_DE_genes, geneset))
N_tot = 20000
# N_tot = 16522
P = phyper(N_intersect, N_geneset, N_tot-N_geneset, N_ST, lower.tail = FALSE, log.p = FALSE)
enrich_matrix[i,j] = P
}
}
row.names(enrich_matrix) = GO_names
enrich_matrix_FDR = data.frame(matrix(1, ncol = length(clusters), nrow = dim(GO_set)[1]))
colnames(enrich_matrix_FDR) = clu_nm
row.names(enrich_matrix_FDR) = GO_names
for (i in seq(1,length(clusters))){
temp = enrich_matrix[,i]
enrich_matrix_FDR[,i] = p.adjust(temp,method=”fdr”)
}
## 过滤掉所有FDR<0.01的基因(FDR-错误发现率)
indx = c()
for (i in seq(1,dim(enrich_matrix_FDR)[1])){
if (min(enrich_matrix_FDR[i,])<0.01){
indx = c(indx,i)
}
}
enrich_matrix_f = enrich_matrix_FDR[indx,]
## 找到每簇的表达最高的20个基因组
all_genesets = row.names(enrich_matrix_f)
top_genesets = c()
for (i in seq(1,length(clusters))){
temp = enrich_matrix_f[,i]
a = sort(temp,index.return = TRUE)
top = a$ix[1:10]
top_genesets = c(top_genesets,all_genesets[top])
}
top_genesets = unique(top_genesets)
enrich_matrix_f = enrich_matrix_f[top_genesets,]
enrich_matrix_log = -log2(enrich_matrix_f+1e-100)
## 绘制热图
my_palette <- colorRampPalette(brewer.pal(10, “RdBu”))(256)
data = data.matrix(enrich_matrix_log)
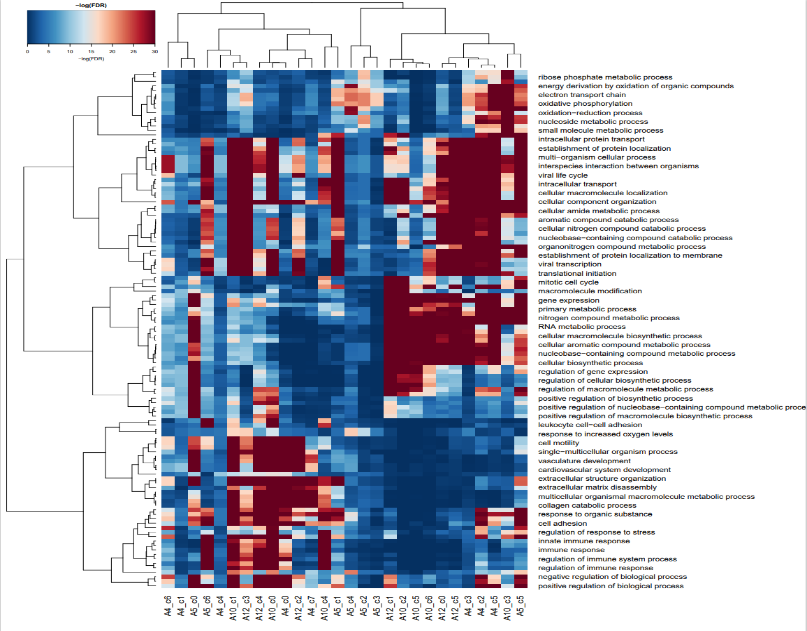
GO-BP-enrichment-top20
如图,是我们富集了表达水平最高的20个基因的热图,其中红色代表高表达水平,蓝色代表低表达水平,还列出了不同的生物学过程和相关基因,比如说在细胞免疫反应过程在A4,A5细胞中的表达量明显比A10和A12高。
## 运用完全链接进行聚类
hr <- hclust(as.dist(1-cor(t(data), method=”spearman”)), method=”complete”)
hc <- hclust(as.dist(1-cor(data, method=”spearman”)), method=”complete”)
data[data>30] = 30
filename = paste0(save_dir,’/heatmap/GO-BP-enrichment-top20.pdf’)
pdf(filename,12,12)
heatmap.2(data,
col = rev(my_palette),
Rowv=as.dendrogram(hr), Colv=as.dendrogram(hc),
trace=”none”,
scale = “none”,
density.info=”none”,
margins=c(5,25),
lhei=c(1,8), lwid=c(1,4),
keysize=0.2, key.par = list(cex=0.5),
cexRow=0.9,cexCol=1,srtCol=90, # rotate column label
key.title = ‘-log(FDR)’,
key.xlab = ‘-log(FDR)’
)
dev.off()
## 从数据中选择特定的生物过程
selected = c(‘extracellular matrix organization’, ‘cell adhesion’, ‘cell migration’,
‘cell cycle process’,’mitotic cell cycle process’,’protein transport’,
‘immune response’,’RNA metabolic process’,’peptide metabolic process’,
‘vasculature development’,
‘extracellular matrix disassembly’,’cellular metabolic process’,
‘cellular respiration’,’respiratory electron transport chain’,
‘response to stress’,’cell motility’)
temp1 = row.names(data)
selected = intersect(selected,temp1)
data1 = data[selected,]
在获得的热图中,依据代码,我们从初步富集分析的结果中,再进行富集分析,并且从中选出表达量高的生物学过程进行聚类,使得整个富集的结果更加简洁。
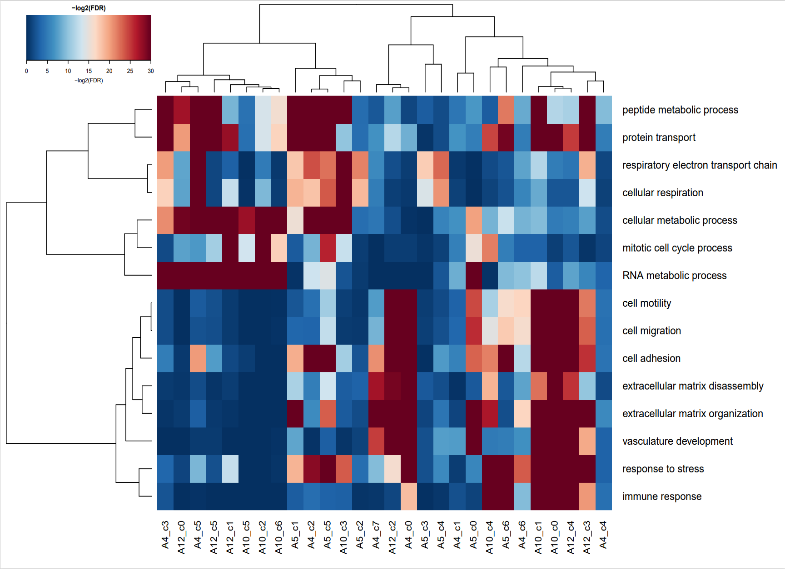
GO-BP-enrichment-selected
第二步:对所有的前景基因(癌症相关成纤维基因)进行GO分析
## 设定GO基因集为高等级的GO terms
database = paste0(data_dir,’/DAVIDKnowledgebase/OFFICIAL_GENE_SYMBOL2GOTERM_BP_2.txt’)
df1 = read.delim2(database, header = FALSE, sep = “\t”)
colnames(df1) = c(‘gene’,’GO_term’)
database = paste0(data_dir,’/DAVIDKnowledgebase/OFFICIAL_GENE_SYMBOL2GOTERM_BP_3.txt’)
df2 = read.delim2(database, header = FALSE, sep = “\t”)
colnames(df2) = c(‘gene’,’GO_term’)
df = rbind(df1,df2)
database = paste0(data_dir,’/DAVIDKnowledgebase/OFFICIAL_GENE_SYMBOL2GOTERM_BP_4.txt’)
df2 = read.delim2(database, header = FALSE, sep = “\t”)
colnames(df2) = c(‘gene’,’GO_term’)
df = rbind(df,df2)
GO = unique(df$`GO_term`)
GO_set = df %>%
group_by(GO_term) %>%
summarise(gene = toString(unique(gene)))
## 过滤多于10个基因的基因集
indx = c()
for (i in seq(1,dim(GO_set)[1])){
temp = GO_set[i,2][[1]]
x = strsplit(temp,’, ‘)
geneset = x[[1]]
if (length(geneset)>10){
indx = c(indx,i)
}
}
GO_set = GO_set[indx,]
## 筛选前景基因的差异表达基因
dir1 = paste0(save_dir,’/ST differentially expresssed genes up and down’)
files = list.files(dir1)
clusters = list()
clu_nm = c()
clusters_select = c(“A4_c0”, “A4_c7”, “A5_c0”, “A5_c1”, “A10_c0”, “A10_c1”, “A10_c4”, “A12_c2”, “A12_c3”, “A12_c4”)
for (i in seq(1,length(files))){
fnm = files[i]
clu = unlist(strsplit(fnm,’.x’))[1]
if (clu %in% clusters_select){
tmp1 = read.table(paste0(dir1,’/’,fnm),header = TRUE, stringsAsFactors = F, check.names=F)
tmp1 = tmp1[tmp1$avg_logFC>0.15,]
tmp1 = tmp1[tmp1$p_val<0.01,]
clusters[[clu]] = list(tmp1$gene)
clu_nm = c(clu_nm,clu)
}
}
## 超几何分布检验
calc_p_fdr <- function(cluster, geneset, N_tot = 20000) {
cluster_DE_genes <- unlist(cluster)
N_ST <- length(cluster_DE_genes)
N_geneset <- length(geneset)
N_intersect <- length(intersect(cluster_DE_genes, geneset))
P <- phyper(N_intersect, N_geneset, N_tot – N_geneset, N_ST, lower.tail = FALSE, log.p = FALSE)
return(P)
}
# 定义一个函数,用于提取 GO 名称和基因集
extract_go_geneset <- function(go_term) {
temp <- as.character(go_term)
x <- strsplit(temp, “, “)
geneset <- x[[1]]
y <- strsplit(temp, “~”)
go_name <- y[[1]][2]
return(list(go_name = go_name, geneset = geneset))
}
GO_list <- map(GO_set, extract_go_geneset)
# 使用 map 函数对 GO_list 的每个元素进行计算操作,得到 P 值的矩阵
enrich_matrix <- map_dfc(clusters, ~ {
map_dbl(GO_list, ~ {
calc_p_fdr(.x, .y$geneset)
})
}) %>%
as.data.frame()
colnames(enrich_matrix) <- clu_nm
GO_names <- map_chr(GO_list, “go_name”)
row.names(enrich_matrix) <- GO_names
enrich_matrix_FDR <- enrich_matrix %>%
mutate(across(everything(), ~
p.adjust(., method = “fdr”)
}))
row.names(enrich_matrix_FDR) <- GO_names
## 过滤掉所有FDR<0.01的基因(FDR-错误发现率)
indx = c()
for (i in seq(1,dim(enrich_matrix_FDR)[1])){
if (min(enrich_matrix_FDR[i,])<0.01){
indx = c(indx,i)
}
}
enrich_matrix_f = enrich_matrix_FDR[indx,]
## 找到每簇的表达最高的20个基因组
all_genesets = row.names(enrich_matrix_f)
top_genesets = c()
for (i in seq(1,length(clusters))){
temp = enrich_matrix_f[,i]
a = sort(temp,index.return = TRUE)
top = a$ix[1:20]
top_genesets = c(top_genesets,all_genesets[top])
}
top_genesets = unique(top_genesets)
enrich_matrix_f = enrich_matrix_f[top_genesets,]
enrich_matrix_log = -log2(enrich_matrix_f+1e-100)
## 绘制热图
my_palette <- colorRampPalette(brewer.pal(10, “RdBu”))(256)
data = data.matrix(enrich_matrix_log)
这一步的分析代码与上一步基本类似,区别在于,上一步分析的是所有样本,而这一步只分析了前景基因这部分样本。
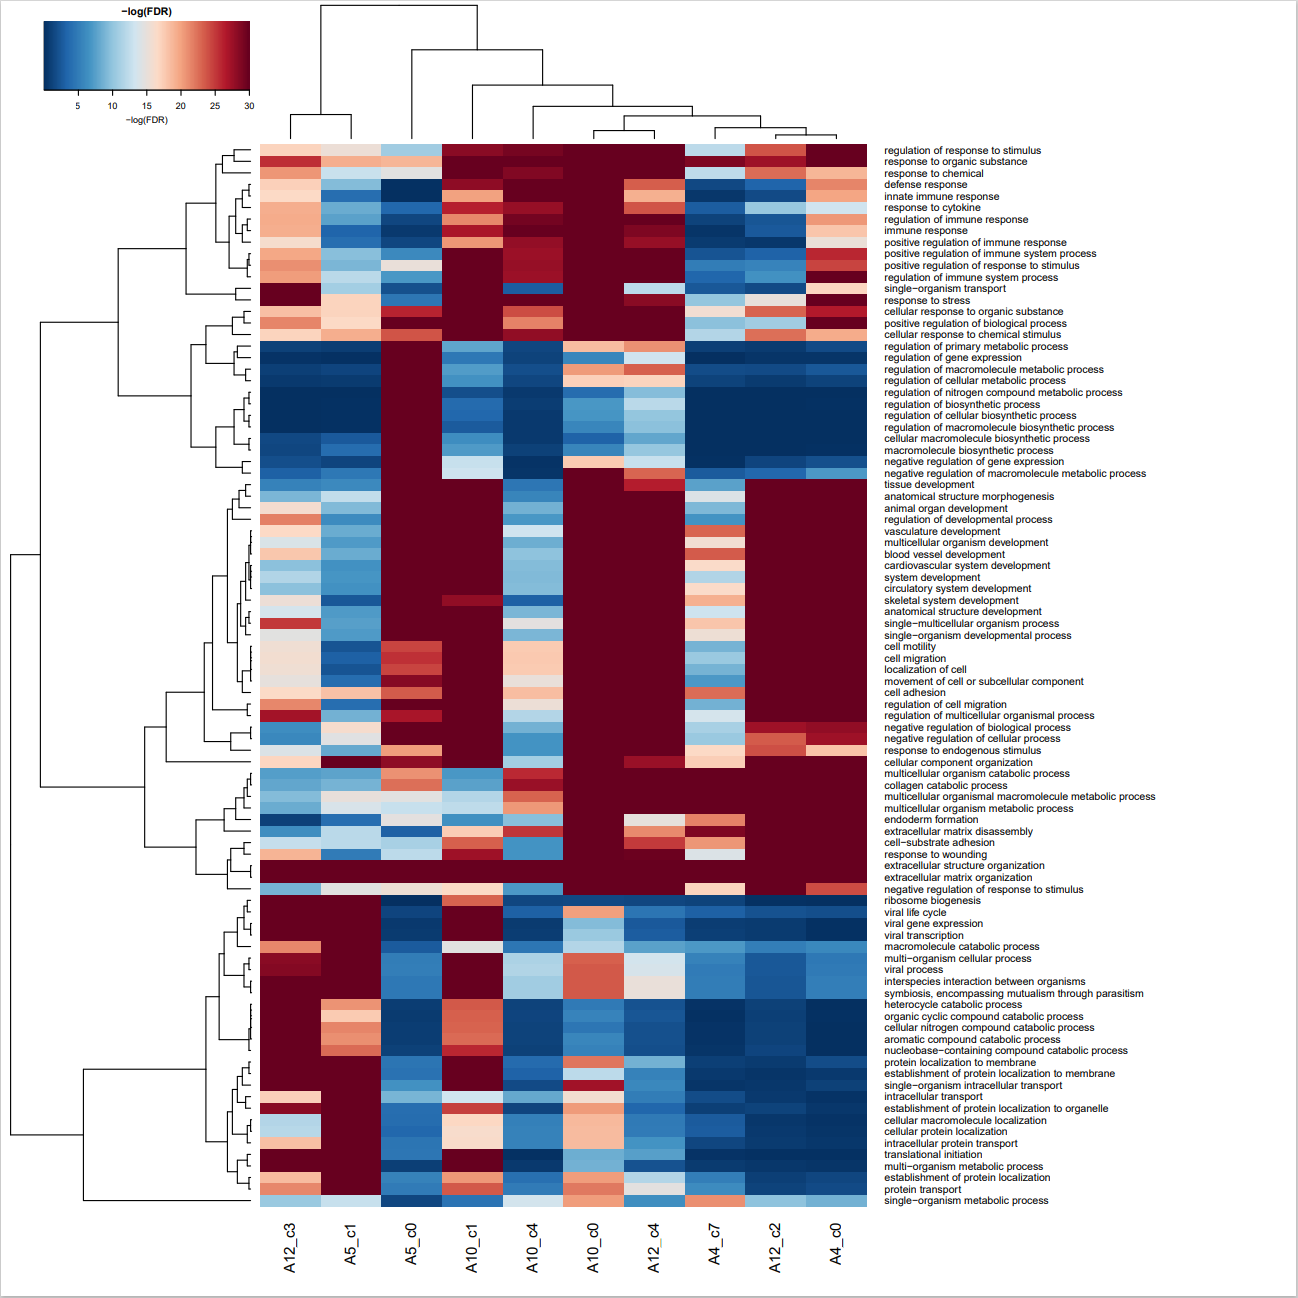
GO-BP-enrichment-CAF-detail
第三步,加载配体受体参考数据库
首先设定配体受体数据库,如图所示,需要导入相关的受体与配体的数据,然乎获取肿瘤和基质空间上的相邻的配体受体对,并提取位点坐标,进行可视化。
## 设定受体配体数据库
dir1 = paste0(data_dir,’/LR_manual_revised.txt’)
file = read.delim(dir1,sep = ‘\t’,stringsAsFactors = FALSE)
folder = paste0(save_dir,’/ligand_receptor’)
if (!file.exists(folder)){
dir.create(folder)
}
dir2 = paste0(folder,’/nearest neighbour ligand receptor interactions of two clusters’)
if (!file.exists(dir2)){
dir.create(dir2)
}
for (sampleid in c(‘A4′,’A5′,’A10′,’A12′)){
fnm = paste0(dir2,’/’,sampleid)
if (!file.exists(fnm)){
dir.create(fnm)
}
}
dir3 = paste0(folder,’/nearest neighbours of two clusters images’)
if (!file.exists(dir3)){
dir.create(dir3)
}
## 获取两个细胞群(肿瘤,基质)中空间上相邻斑点的配体受体对
# 定义一个函数,用于计算基因表达的均值和标准差
calc_expression <- function(SOE, gene, tumor_loc, stroma_loc, stroma_ids) {
# 调用 min_distance 函数,得到基质到肿瘤的最小距离
dist_to_tumor <- min_distance(tumor_loc, stroma_loc)
distance <- sort(unique(dist_to_tumor))
data_mat <- SOE@assays$SCT@scale.data[, stroma_ids]
expression_dist_mean <- map_dbl(distance, ~ {
indx <- which(dist_to_tumor == .x)
mean_exp <- mean(data_mat[gene, indx])
return(mean_exp)
})
expression_dist_std <- map_dbl(distance, ~ {
indx <- which(dist_to_tumor == .x)
std_exp <- sd(data_mat[gene, indx])
return(std_exp)
}
return(list(expression_dist_mean, expression_dist_std))
}
# 定义一个函数,用于计算最小距离
min_distance <- function(tumor_loc, stroma_loc) {
mini_dist <- map_dbl(stroma_loc, ~ {
xF <- .x[1]
yF <- .x[2]
min_distance <- 100000
dist <- map_dbl(tumor_loc, ~ {
# 提取当前点的 x 和 y 坐标
xT <- .x[1]
yT <- .x[2]
sqrt((xF – xT)^2 + (yF – yT)^2)
})
min_distance <- min(dist)
return(min_distance)
})
return(mini_dist)
}
## 提取所有位点的坐标
extract_loc <- function(SOE,SID){
tmp = as.matrix(GetAssayData(object = SOE, assay = “SCT”, slot = “data”))
tmp1 = colnames(tmp)
if (nchar(SID)==1){
tmp1 = substr(tmp1,4,100)
} else{
tmp1 = substr(tmp1,5,100)
}
x = as.numeric(unlist(lapply(tmp1, function(x){strsplit(x,”x”)[[1]][1]})))
y = as.numeric(unlist(lapply(tmp1, function(x){strsplit(x,”x”)[[1]][2]})))
d = data.frame(x,y)
return(d)
}
## 找到两个距离最近的簇
find_nearest_spots = function(SOE,loc,clu1,clu2){
Location = loc
temp = SOE@meta.data$seurat_clusters
clu1ID = which(temp==clu1)
clu2ID = which(temp==clu2)
Nearest_clu_ID = data.frame(c1 = integer(0),c2 = integer(0))
count = 1
for (i in seq(1,length(clu1ID))){
xF = Location[clu1ID[i],1]
yF = Location[clu1ID[i],2]
for (j in seq(1,length(clu2ID))){
xT = Location[clu2ID[j],1]
yT = Location[clu2ID[j],2]
distance = (xF-xT)^2+(yF-yT)^2
if (distance<=1){
Nearest_clu_ID[count,1] = clu1ID[i]
Nearest_clu_ID[count,2] = clu2ID[j]
count = count+1
}
}
}
return(Nearest_clu_ID)
}
## 可视化
# 定义一个函数,用于计算点的位置
get_points <- function(d, topleft, topright, bottomleft, bottomright) {
delta_x = mean(abs(topright[1] – topleft[1]), abs(bottomright[1] – bottomleft[1])) / 32
delta_y = mean(abs(topright[2] – bottomright[2]), abs(topleft[2] – bottomleft[2])) / 34
adjust_x = function(step) {return((step – 1) * (bottomleft[1] – topleft[1]) / 34)}
adjust_y = function(step) {return((step – 1) * (topright[2] – topleft[2]) / 32)}
x = topleft[1] + (d[, 1] – 1) * delta_x + apply(d, 1, function(x) {return(adjust_x(x[2]))})
y = topleft[2] – (d[, 2] – 1) * delta_y + apply(d, 1, function(x) {return(adjust_y(x[1]))})
return(data.frame(x, y))
}
# 定义一个函数,用于绘制图片
draw_image <- function(im, im1, points, mycols) {
png(width = 512, height = 512)
par(mar = c(0, 0, 0, 0)) # 设置零边距
plot(x = NULL, y = NULL, xlim = c(0, dim(im)[1]), ylim = c(0, dim(im)[2]), pch = ”,
xaxt = ‘n’, yaxt = ‘n’, xlab = ”, ylab = ”, xaxs = ‘i’, yaxs = ‘i’,
bty = ‘n’) # 绘制空白图
rasterImage(im1, xleft = 0, ybottom = 0, xright = dim(im1)[1], ytop = dim(im1)[2]) # 添加肿瘤轮廓
points(points$x, points$y, col = mycols, pch = 20, cex = 3) # 添加聚类点
dev.off()
}
# 定义一个函数,用于选择聚类
select_cluster <- function(clu1, clu2, SID, SOE) {
d = extract_loc(SOE, SID) # 提取位置信息
temp = SOE@meta.data$seurat_cluster # 提取聚类信息
nspots = length(temp)
mycols <- rep(‘snow2’, nspots)
mycolpalette = c(‘orange’, ‘paleturquoise4′)
tmp = find_nearest_spots(SOE, d, clu1, clu2)
clu1ID = tmp[, 1] # 提取第一个聚类的ID
clu2ID = tmp[, 2]
mycols[clu1ID] = mycolpalette[1] # 设置第一个聚类的颜色
mycols[clu2ID] = mycolpalette[2]
return(mycols)
}
# 定义一个函数,用于可视化
visualize <- function(SID, clu1, clu2) {
if (SID == ’10’) {
fnm = paste0(image_dir, ‘/Sample_’, SID, ‘_clear.jpg’) # downsample to 0.25x
im = load.image(fnm)
xd = dim(im)[1]
yd = dim(im)[2]
topleft = c(18, yd – 22)
topright = c(1046, yd – 18)
bottomleft = c(18, yd – 1116)
bottomright = c(1043, yd – 1112)
} else if (SID == ’12’) {
fnm = paste0(image_dir, ‘/Sample_’, SID, ‘_clear.jpg’) # downsample to 0.25x
im = load.image(fnm)
xd = dim(im)[1]
yd = dim(im)[2]
topleft = c(32, yd – 30)
topright = c(984, yd – 22)
bottomleft = c(40, yd – 1114)
bottomright = c(992, yd – 1106)
} else if (SID == ‘4’) {
fnm = paste0(image_dir, ‘/Sample_’, SID, ‘_ds.jpg’) # downsample to 0.25x
im = load.image(fnm)
xd = dim(im)[1]
yd = dim(im)[2]
topleft = c(58, yd – 50)
topright = c(1412, yd – 64)
bottomleft = c(48, yd – 1512)
bottomright = c(1400, yd – 1524)
} else if (SID == ‘5’) {
fnm = paste0(image_dir, ‘/Sample_’, SID, ‘_ds.jpg’) # downsample to 0.25x
im = load.image(fnm)
xd = dim(im)[1]
yd = dim(im)[2]
topleft = c(30, yd – 12)
topright = c(1382, yd – 20)
bottomleft = c(22, yd – 1458)
bottomright = c(1368, yd – 1464)
}
# 加载肿瘤轮廓图片
fnm = paste0(save_dir, ‘/map_tumor_outline’, ‘/A’, SID, ‘_tumor_outline.png’) # downsample to 0.25x
im1 = load.image(fnm)
# 选择聚类
mycols = select_cluster(clu1, clu2, SID, SOE)
# 计算点的位置
points = get_points(d, topleft, topright, bottomleft, bottomright)
# 绘制图片
draw_image(im, im1, points, mycols)
}
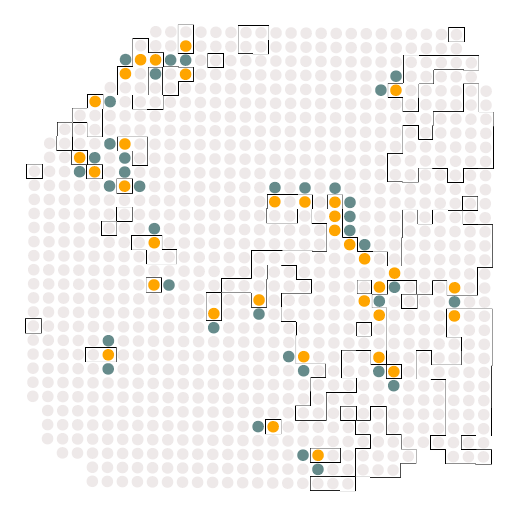
A4_c2_c0
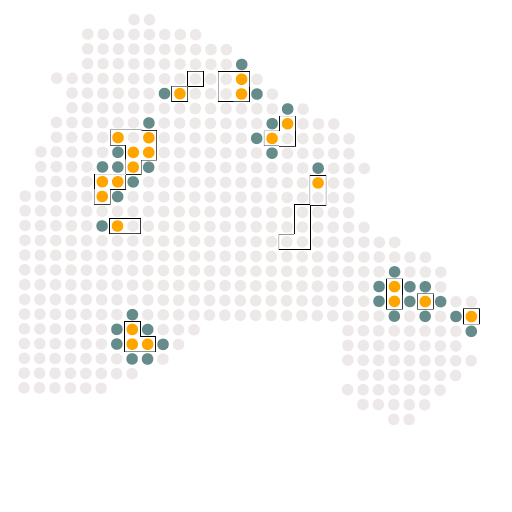
A5_c5_c0
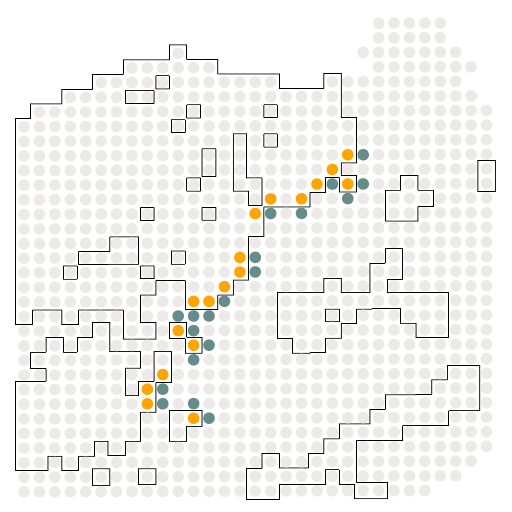
A10_c2_c0
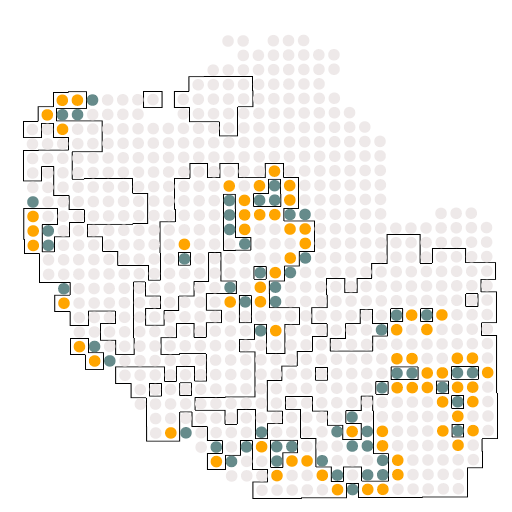
A12_c0_c2
结果如图所示,是受体与配体的相关配对情况,这个结果对于我们后续绘制冲积图是必须的。
## 设定主函数,循环
SIDs = c(rep(‘4’,6),rep(‘5′,4),rep(’10’,5),rep(’12’,9)) # sample ID
clu1s = c(rep(2,5),rep(5,5),rep(2,2),rep(5,1),rep(6,2),rep(0,3),rep(1,3),rep(5,3)) # tumor clusters
clu2s = c(0,1,3,6,7,7,0,1,2,6,0,4,0,0,1,2,3,4,2,3,4,2,3,4) # stroma clusters
for (i in seq(1,length(clu1s))){
if (SIDs[i]==’4′){
SOE = sample4
}
if (SIDs[i]==’5′){
SOE = sample5
}
if (SIDs[i]==’10’){
SOE = sample10
}
if (SIDs[i]==’12’){
SOE = sample12
}
SID = SIDs[i]
clu1 = clu1s[i]
clu2 = clu2s[i]

A4_ligand_c0_receptor_c2
除了可视化的结果之外,我们还可以从文件中观察到四个样本的受体配体配对情况。
第四步,绘制每个样品的配体-受体相互作用的 ggalluvial 图
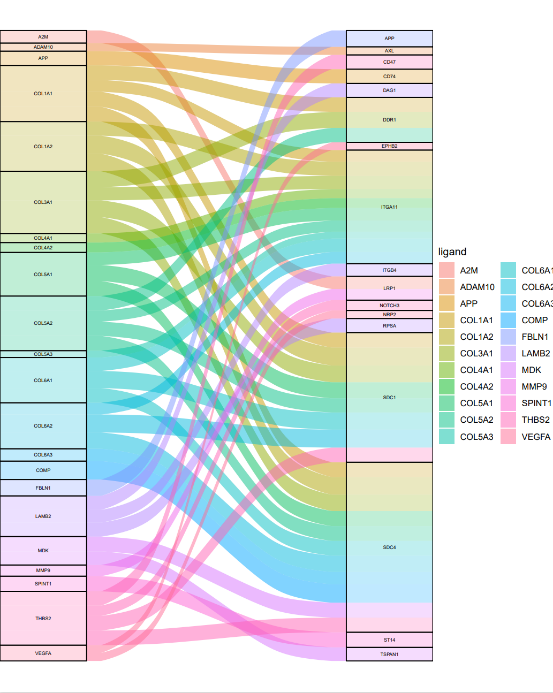
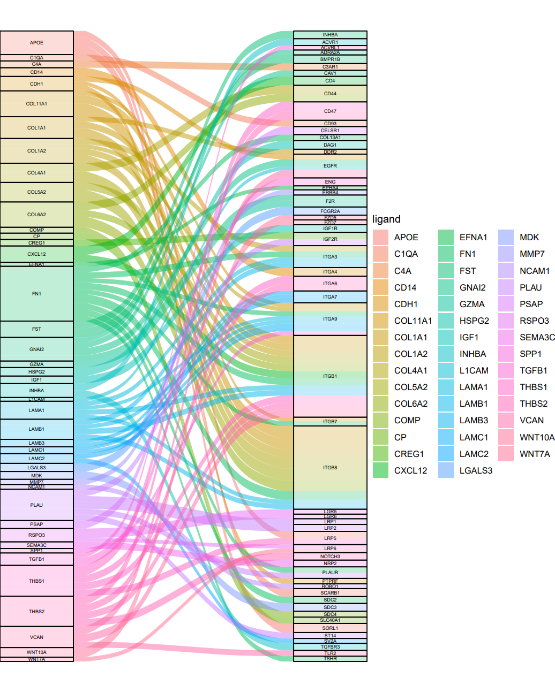
依据小果提供的代码,分别为为LTS,STS分别绘制 ggalluvial 图,如图所示,依据ggalluvial 图,可以非常清晰的看到不同的基因表达产物的受体配体的配对关系,根据A4,A5,A10,A12,汇集为LTS(长生存周期患者),STS(短生存周期患者),即可辨明导致病人生存周期变化的关键基因,从而为癌的治理提供指导。
## 绘制 ggalluvial 图
ggall_plot <- function(df){
ggplot(data = df,
aes(axis1 = ligand, axis2 = receptor, y = sqrt(connection))) +
geom_alluvium(aes(fill = ligand)) +
geom_stratum(alpha = .5, width = 1/4) +
geom_text(stat = “stratum”,size = 1.9,
aes(label = after_stat(stratum))) +
scale_x_discrete(limits = c(“ligand”, “receptor”),
expand = c(0.1, 0)) +
theme_void()
}
## 为个体样本绘制 ggalluvial 图
for (j in seq(1,length(dirs))){
files = list.files(dirs[j])
df = data.frame()
for (i in seq(1,length(files))){
file = paste0(dirs[j],’/’,files[i])
tmp = read.delim2(file,sep = ‘,’)
tmp$avg_logFC.of.ligand = as.numeric(as.character(tmp$avg_logFC.of.ligand))
tmp$avg_logFC.of.receptor = as.numeric(as.character(tmp$avg_logFC.of.receptor))
tmp$fraction.of.spots.the.ligand.is.detected = as.numeric(as.character(tmp$fraction.of.spots.the.ligand.is.detected))
tmp$fraction.of.spots.the.receptor.is.detected = as.numeric(as.character(tmp$fraction.of.spots.the.receptor.is.detected))
tmp$connection = sqrt((tmp$avg_logFC.of.ligand)*(tmp$avg_logFC.of.receptor)*(tmp$fraction.of.spots.the.ligand.is.detected)*(tmp$fraction.of.spots.the.receptor.is.detected))
df = rbind(df,tmp)
}
df = df[,c(‘ligand’,’receptor’,’connection’)]
df1 = aggregate(df$connection,by = list(df$ligand,df$receptor),FUN = mean)
colnames(df1) = c(‘ligand’,’receptor’,’connection’)
temp = str_split(dirs[j],’/’)
fnm = temp[[1]][length(temp[[1]])]
print(fnm)
#plot.new()
pdf(paste0(folder,’/’,fnm,’.pdf’),8,8)
fig = ggall_plot(df1)
print(fig)
dev.off()
# chordDiagram(df1)
}
## 为LTS/STS绘制 ggalluvial 图
## STS
df = data.frame()
for (j in seq(1,2)){
files = list.files(dirs[j])
for (i in seq(1,length(files))){
file = paste0(dirs[j],’/’,files[i])
tmp = read.delim2(file,sep = ‘,’)
tmp$avg_logFC.of.ligand = as.numeric(as.character(tmp$avg_logFC.of.ligand))
tmp$avg_logFC.of.receptor = as.numeric(as.character(tmp$avg_logFC.of.receptor))
tmp$fraction.of.spots.the.ligand.is.detected = as.numeric(as.character(tmp$fraction.of.spots.the.ligand.is.detected))
tmp$fraction.of.spots.the.receptor.is.detected = as.numeric(as.character(tmp$fraction.of.spots.the.receptor.is.detected))
tmp$connection = sqrt((tmp$avg_logFC.of.ligand)*(tmp$avg_logFC.of.receptor)*(tmp$fraction.of.spots.the.ligand.is.detected)*(tmp$fraction.of.spots.the.receptor.is.detected))
df = rbind(df,tmp)
}
}
df = df[,c(‘ligand’,’receptor’,’connection’)]
df1 = aggregate(df$connection,by = list(df$ligand,df$receptor),FUN = mean)
colnames(df1) = c(‘ligand’,’receptor’,’connection’)
pdf(paste0(folder,’/STS.pdf’),8,10)
fig = ggall_plot(df1)
print(fig)
dev.off()
## LTS
df = data.frame()
for (j in seq(3,4)){
files = list.files(dirs[j])
for (i in seq(1,length(files))){
file = paste0(dirs[j],’/’,files[i])
tmp = read.delim2(file,sep = ‘,’)
tmp$avg_logFC.of.ligand = as.numeric(as.character(tmp$avg_logFC.of.ligand))
tmp$avg_logFC.of.receptor = as.numeric(as.character(tmp$avg_logFC.of.receptor))
tmp$fraction.of.spots.the.ligand.is.detected = as.numeric(as.character(tmp$fraction.of.spots.the.ligand.is.detected))
tmp$fraction.of.spots.the.receptor.is.detected = as.numeric(as.character(tmp$fraction.of.spots.the.receptor.is.detected))
tmp$connection = sqrt((tmp$avg_logFC.of.ligand)*(tmp$avg_logFC.of.receptor)*(tmp$fraction.of.spots.the.ligand.is.detected)*(tmp$fraction.of.spots.the.receptor.is.detected))
df = rbind(df,tmp)
}
}
df = df[,c(‘ligand’,’receptor’,’connection’)]
df1 = aggregate(df$connection,by = list(df$ligand,df$receptor),FUN = mean)
colnames(df1) = c(‘ligand’,’receptor’,’connection’)
pdf(paste0(folder,’/LTS.pdf’),8,10)
fig = ggall_plot(df1)
print(fig)
dev.off()
LTS
STS
如图是我们绘制的冲积图,可以非常直观的观察到受体与配体的分布情况以及反应情况,同时,也可以根据标记的受体与配体名称对差异基因进行区分,可以说是一举两得。
以上就是小果今天给大家带来的使用富集分析的结果与ggalluvial绘制冲积图的教程啦,如果大家对今天的分享有任何疑问,欢迎关注公众号向小果提问,我们有专门的生信分析服务哦。同时,如果大家没有做出来图也不要灰心,可以试一试我们的云生信小工具哦,只要输入合适的数据以及指令就可以直接绘制想要的图呢,链接:http://www.biocloudservice.com/home.html。