想提高单细胞注释准确度?“手动校正+验证分析”必不可少!

在进行单个细胞水平的分析时,单细胞转录组测序技术是非常便利高效的一种技术,它可以通过测量单个细胞中所有基因的表达水平,从而读取细胞的“日记”,这样我们就可以很容易的知道细胞在做什么,想什么,感受什么,以及其生命活动和什么有联系。
而在进行单细胞转录组测序分析的时候,我们常常绕不开给细胞进行注释这一步骤,也就是根据单细胞转录组数据,对不同的细胞聚类进行细胞类型的标识和命名,这一步中通常使用的是自动注释, 对自动注释而言,是一种利用算法和适当的先验生物学知识对细胞或细胞簇进行标记的方法,这种方法虽然高速有效,却存在错误注释的可能性。
基准研究表明,自动注释工具的性能是处于变化中的,它的精准度取决于被注释细胞类型的数据集和基因表达谱的独特性,比如说,使用自动注释区分T细胞和B细胞相对简单,但使用自动注释工具区分CD8+细胞毒性T细胞和自然杀伤细胞却比较困难。因此,我们需要对自动注释进行手动改进以及验证分析,从而让我们的注释结果更加准确可信。本次代码的数据量偏大,欢迎大家来租赁我们的服务器哦,关注公众号还可以获得独特的生信分析思路定制~
公众号后台回复“111”
领取本篇代码、基因集或示例数据等文件
文件编号:240124
需要租赁服务器的小伙伴可以扫码添加小果,此外小果还提供生信分析,思路设计,文献复现等,有需要的小伙伴欢迎来撩~

 |

Step 1 安装R包install.packages(c("BiocManager","Seurat","SCINA","ggplot2","devtools","shiny")) BiocManager::install(c("SingleCellExperiment","scater","dplyr", "scmap","celldex","SingleR","GSVA","S4Vectors", "SummarizedExperiment"))devtools::install_github("immunogenomics/harmony")devtools::install_github("romanhaa/cerebroApp")devtools::install_github("mw201608/msigdb")Step 2 基于参考的自动注释#从GEO数据库下载数据(由于已经下载好了所以直接导入文件即可)set.seed(9742)ref <- readRDS("../data/data_DICE.RData")#格式化数据,确保与正在使用的工具兼容,这里使用的是scmap# 在名为“cell_type1”的列中分配单元格类型标签SummarizedExperiment::colData(ref)$cell_type1 <- SummarizedExperiment::colData(ref)$label.fine# 在名为“feature_symbol”的列中分配基因名称SummarizedExperiment::rowData(ref)$feature_symbol <- rownames(ref)# 将数据转换为SingleCellExperiment对象ref_sce <- SingleCellExperiment::SingleCellExperiment(assays=list(logcounts=Matrix::Matrix(SummarizedExperiment::assays(ref)$logcounts)),colData=SummarizedExperiment::colData(ref),rowData=SummarizedExperiment::rowData(ref))
#首先选择信息最丰富的特征来创建 scmap-cluster 参考ref_sce <- scmap::selectFeatures(ref_sce, suppress_plot=FALSE)

#检查 scmap 选择的前 50 个基因rownames(ref_sce)[which(SummarizedExperiment::rowData(ref_sce)$scmap_features)][1:50]

#通过检查基因名称向量的长度来检查选择了多少个基因length(rownames(ref_sce)[which(SummarizedExperiment::rowData(ref_sce)$scmap_features)])

#创建要使用的关键标记的列my_key_markers = c("TRAC", "TRBC1", "TRBC2", "TRDC", "TRGC1", "TRGC2", "IGKC")# 确保标记位于 scmap 使用的功能列表中SummarizedExperiment::rowData(ref_sce)$scmap_features[rownames(ref_sce) %in% my_key_markers] <- TRUE# 通过再次检查基因名称向量的长度来检查是否添加了任何基因长度length(rownames(ref_sce)[which(SummarizedExperiment::rowData(ref_sce)$scmap_features)])

# 从数据集中创建线粒体基因列表(以“MT”开头的基因)mt_genes <- rownames(ref_sce)[grep("^MT-", rownames(ref_sce))]# 从 scmap 使用的特征中删除这些基因SummarizedExperiment::rowData(ref_sce)$scmap_features[rownames(ref_sce) %in% mt_genes] <- FALSE# 检查有多少个基因length(rownames(ref_sce)[which(SummarizedExperiment::rowData(ref_sce)$scmap_features)])

#提取特征并将其分配给新变量“scmap_feature_genes”scmap_feature_genes <- rownames(ref_sce)[which(SummarizedExperiment::rowData(ref_sce)$scmap_features)]#基因/特征的数量与我们刚刚检查的相同length(scmap_feature_genes)
 |
# 创建参考资料;# 生成参考配置文件后,scmap-cluster 不需要原始数据ref_sce <- scmap::indexCluster(ref_sce)# 将功能可视化为热图# 重新格式化数据,以便它们可以用作 ggplot2 的输入cormat <- reshape2::melt(as.matrix(S4Vectors::metadata(ref_sce)$scmap_cluster_index))# 绘图 ggplot2::ggplot(cormat, ggplot2::aes(x = Var2, y = Var1, fill = value)) + ggplot2::geom_tile() + ggplot2::scale_fill_gradient2(low = "blue", high = "darkred", name = "Expression value") + ggplot2::theme_minimal() + ggplot2::theme(axis.text.x = ggplot2::element_text(angle = 90, vjust = 1, size = 18, hjust = 1), axis.text.y = ggplot2::element_text(size = 15), axis.title.x = ggplot2::element_blank(), axis.title.y = ggplot2::element_blank())

结果如图所示,这个图片显示了不同类型的细胞与特定基因之间的关系。颜色的深浅表示关联程度或活动水平的高低。小果这里只截取了一部分,完整的图片大家可以自己试着绘制哦~
# 将表达式信息存储为变量scmap_cluster_reference <- S4Vectors::metadata(ref_sce)$scmap_cluster_index# 更新之前的引用以也包含 scmap-cell 引用ref_sce <- scmap::indexCell(ref_sce)#从引用中提取 scmap 索引并将其存储为变量scmap_cell_reference <- S4Vectors::metadata(ref_sce)$scmap_cell_index# 从引用中提取关联的细胞 ID 并保存为变量scmap_cell_metadata <- SummarizedExperiment::colData(ref_sce)
data <- Seurat::Read10X("../data/hg19/")# 从原始矩阵中进行 SingleCellExperimentquery_sce <- SingleCellExperiment::SingleCellExperiment(assays=list(counts=data))# 从 Seurat 对象制作 SingleCellExperimentquery_seur <- Seurat::CreateSeuratObject(data)query_sce <- Seurat::as.SingleCellExperiment(query_seur)# 使用 scatter 包标准化数据query_sce <- scater::logNormCounts(query_sce)# 添加feature_symbol列(即基因符号)SummarizedExperiment::rowData(query_sce)$feature_symbol <- rownames(query_sce)
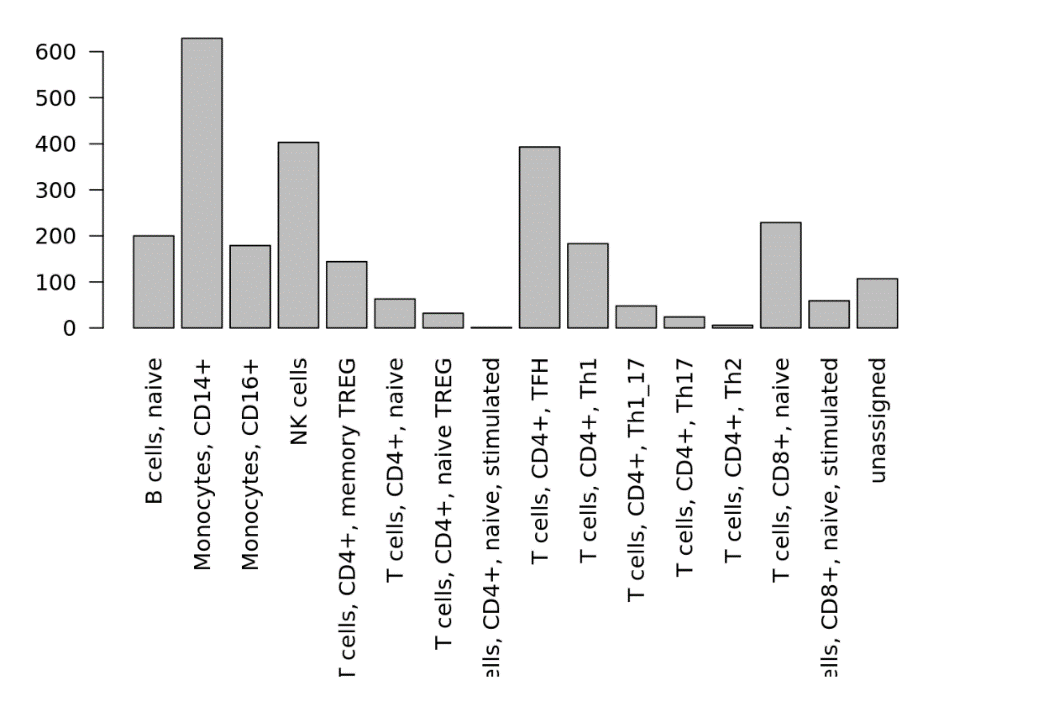
# 运行 scmapClusterscmap_cluster_res <- scmap::scmapCluster(projection=query_sce,index_list=list(immune1 = scmap_cluster_reference),threshold=0.1)# 绘制注释结果par(mar=c(13, 4, 1, 0))barplot(table(scmap_cluster_res$combined_labs), las=2)

上图就是我们进行注释的结果啦,可以看到Monocytes CD14+细胞的数量是最多的。
# 将此注释信息存储在查询对象中SummarizedExperiment::colData(query_sce)$scmap_cluster <- scmap_cluster_res$combined_labs# 制作单元格的 UMAP,并使用 scmapCluster 中的单元格类型注释进行标记query_sce <- scater::runUMAP(query_sce)scater::plotReducedDim(query_sce, dimred="UMAP", colour_by="scmap_cluster")

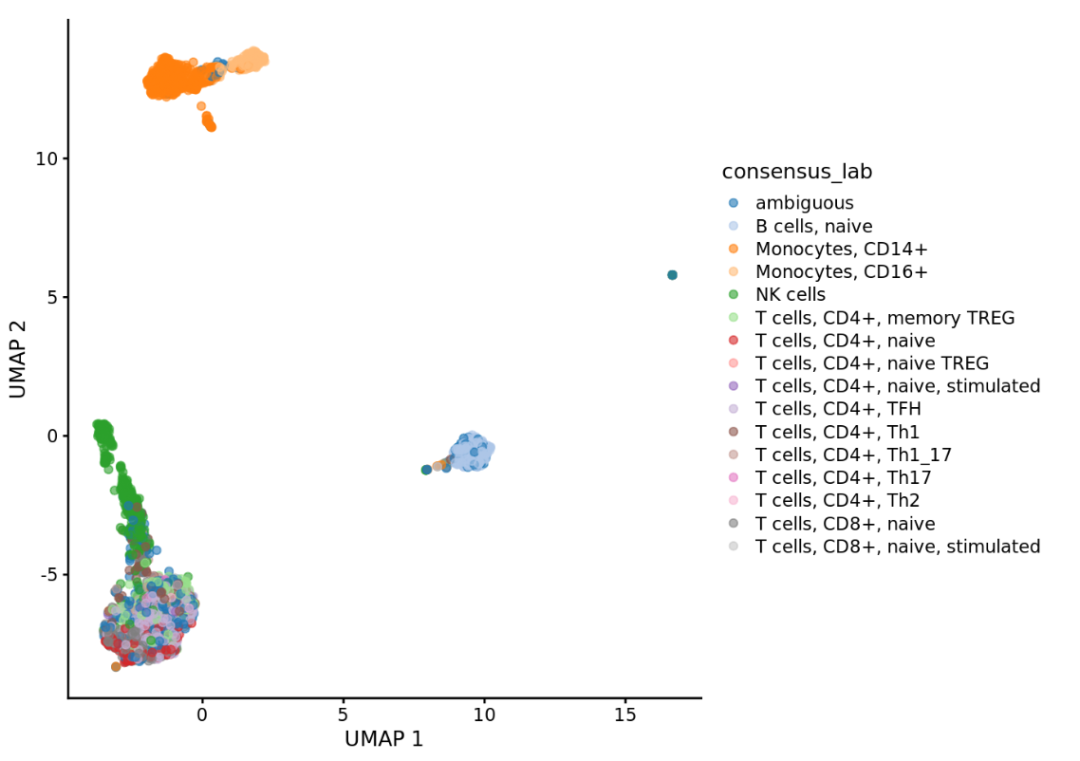
Step 3 细化注释在这里我们使用跨工具的最常见标签来分配最终的自动注释标签。annotation_columns <- c("scmap_cluster", "scmap_cell", "singleR", "Harmony_lab")get_consensus_label <- function(labels){ labels <- labels[labels != "ambiguous"]if (length(labels) == 0) {return("ambiguous")} freq <- table(labels) label <- names(freq)[which(freq == max(freq))]if (length(label) > 1) {return("ambiguous")}return(label)}SummarizedExperiment::colData(query_sce)$consensus_lab <- apply(SummarizedExperiment::colData(query_sce)[,annotation_columns], 1, get_consensus_label)scater::plotReducedDim(query_sce, dimred="UMAP", colour_by="consensus_lab")
 |
细化的结果如图,可以从侧边的标注看出来明显比之前的分类更加细致了。
# 使用 Seurat 的 SCTransform 函数缩放和标准化数据query_seur <- Seurat::SCTransform(query_seur)
#接下来,对数据执行不同类型的降维,以便可以在二维空间中将单元格组合在一起。query_seur <- Seurat::RunPCA(query_seur)query_seur <- Seurat::RunTSNE(query_seur)query_seur <- Seurat::RunUMAP(query_seur, dims = 1:50)#以选定的分辨率对数据进行聚类# 确定每个单元格的“最近邻居”query_seur <- Seurat::FindNeighbors(query_seur, dims = 1:50)# 聚类query_seur <- Seurat::FindClusters(query_seur, resolution = 0.5)#可视化Seurat::DimPlot(query_seur, reduction = "UMAP")
 |
#使用 Seurat 中的 FindAllMarkers 函数来完成markers_seur <- Seurat::FindAllMarkers(query_seur, only.pos = TRUE)# 查看标记,它们按照每个簇的 p 值从最低到最高的顺序排列markers_seur
 |
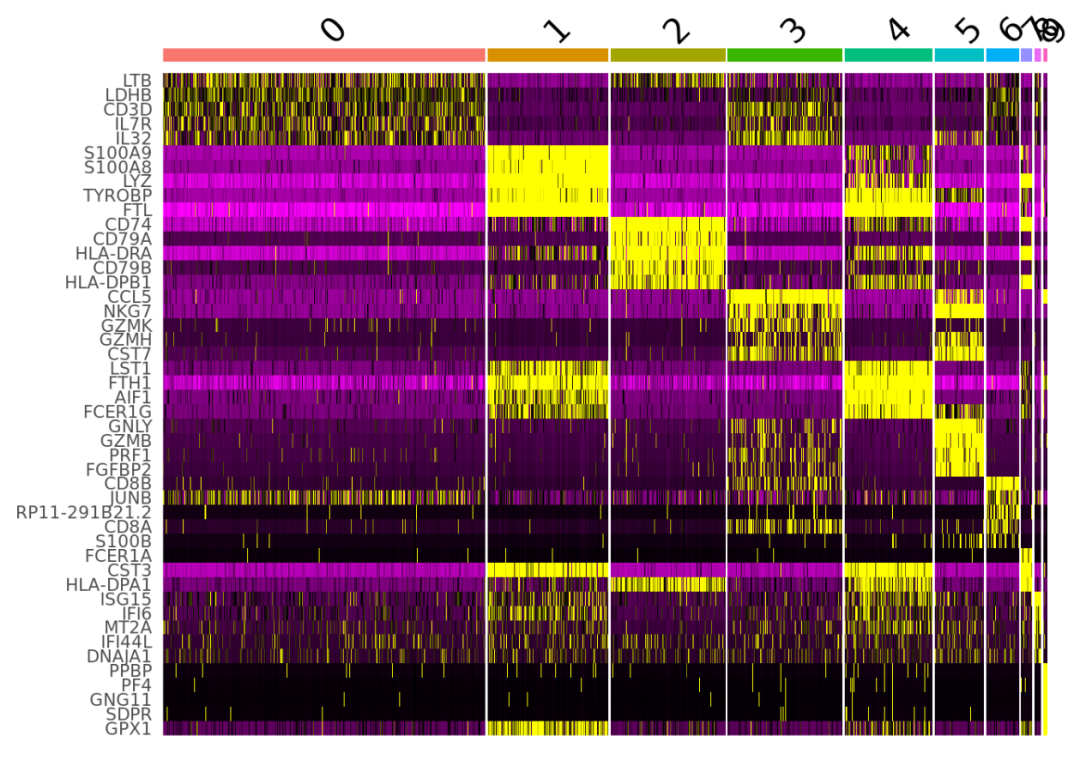
结果如图,是我们挑选的标记基因。不同细胞簇之间的标记基因的表达通常用点图或热图来展示。点图显示了每个细胞簇中表达某个标记基因的细胞的百分比(点的大小)和该细胞簇的平均检测到的基因表达水平。热图显示了不同细胞簇的平均标记基因表达水平。这两种图都是用Seurat创建的。
require(dplyr)# 检索每个簇的前 5 个标记基因# 使用 AVG_LOG 列下具有最高值的基因top5 <- markers_seur %>% group_by(cluster) %>%dplyr::slice_max(get(grep("^avg_log", colnames(markers_seur), value = TRUE)),n = 5)# 绘制点图Seurat::DotPlot(query_seur, features = unique(top5$gene)) +ggplot2::theme(axis.text.x = ggplot2::element_text(angle = 90, vjust = 1,size = 8, hjust = 1)) +Seurat::NoLegend()
 如图所示,清晰的显示了每个细胞簇中表达某个标记基因的细胞的百分比(点的大小)和该细胞簇的平均检测到的基因表达水平。
# 绘制热图Seurat::DoHeatmap(query_seur, features = unique(top5$gene)) +Seurat::NoLegend() +ggplot2::theme(axis.text.y = ggplot2::element_text(size = 8))


定制生信分析
服务器租赁
扫码咨询小果


往期回顾
|
01 |
|
02 |
|
03 |
|
04 |