小果带你认识R数据可视化之图例设置(二)

小果在之前的文章中讲述了图例设置的一些用法,那么接下来小果就继续讲述剩下的一些内容,在这之前小果还是先强烈推荐一下自己的工具平台(http://www.biocloudservice.com/home.html),那接下来废话不多说,直接开始吧。
1. 基本坐标轴设置
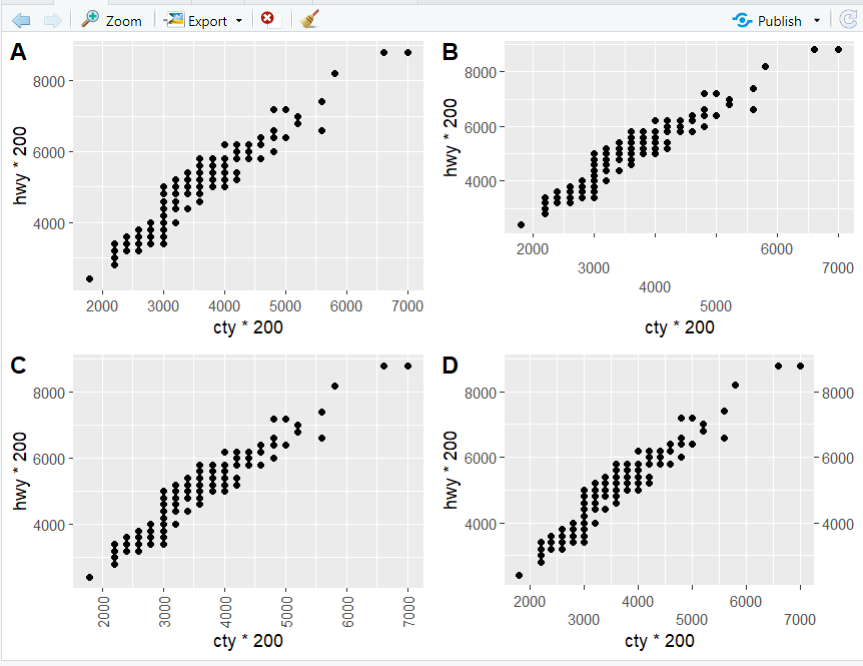
> guide_axis(+ title = waiver(),+ check.overlap = FALSE,+ angle = NULL,+ n.dodge = 1,+ order = 0,+ position = waiver()+ )> p <- ggplot(mpg, aes(cty * 200, hwy * 200)) ++ geom_point()> # 设置行数> p1 <- p + scale_x_continuous(guide = guide_axis(n.dodge = 4))> # 设置角度> p2 <- p + guides(x = guide_axis(angle = 90))> # 复制轴> p3 <- p + guides(x = guide_axis(n.dodge = 2), y.sec = guide_axis())> plot_grid(p, p1, p2, p3, labels = LETTERS[1:4], ncol = 2)

2. 分箱图例
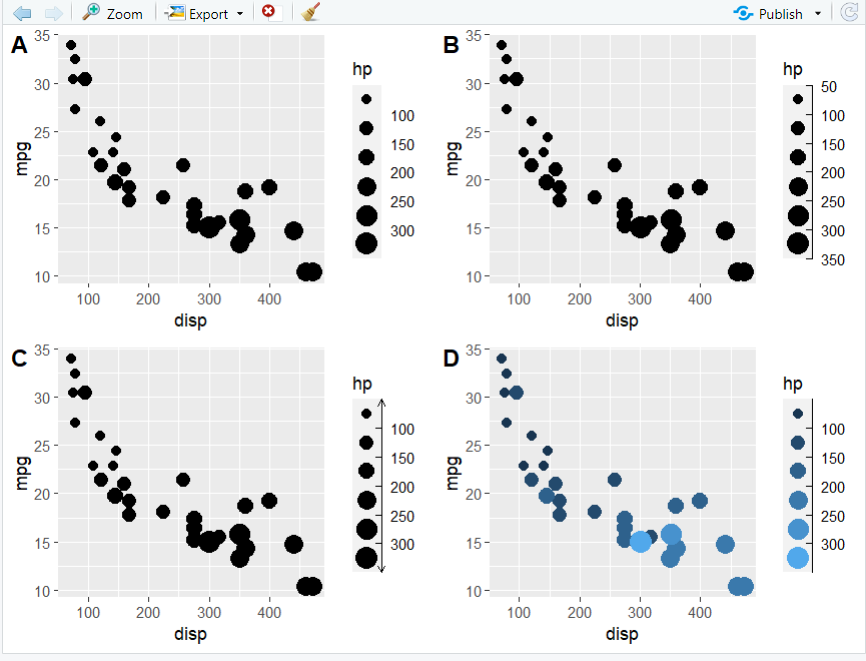
> p <- ggplot(mtcars) ++ geom_point(aes(disp, mpg, size = hp)) ++ scale_size_binned()> # 删除> p1 <- p + guides(size = guide_bins(axis = FALSE))> # 显示区间> p2 <- p + guides(size = guide_bins(show.limits = TRUE))> # 设置轴的箭头> p3 <- p + guides(size = guide_bins(+ axis.arrow = arrow(length = unit(1.5, 'mm'), ends = 'both')+ ))> # 默认将图例合并> p4 <- ggplot(mtcars) ++ geom_point(aes(disp, mpg, size = hp, colour = hp)) ++ scale_size_binned() ++ scale_colour_binned(guide = "bins")> plot_grid(p1, p2, p3, p4, labels = LETTERS[1:4], ncol = 2)

3. 分箱颜色映射
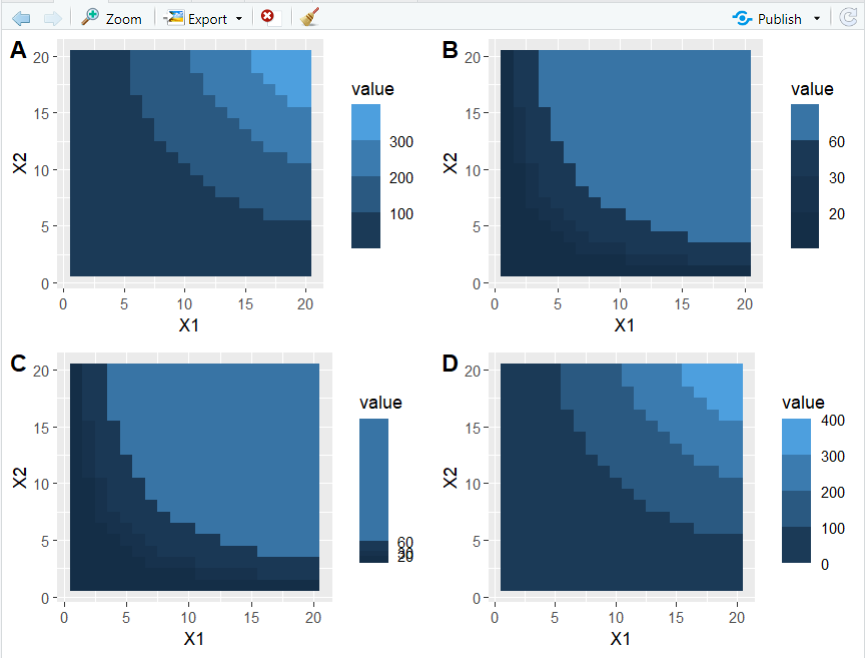
> df <- expand.grid(X1 = 1:20, X2 = 1:20)> df$value <- df$X1 * df$X2> p <- ggplot(df, aes(X1, X2)) + geom_tile(aes(fill = value))> p1 <- p + scale_fill_binned()> p2 <- p + scale_fill_binned(breaks = c(20, 30, 60))> p3 <- p + scale_fill_binned(+ breaks = c(20, 30, 60),+ guide = guide_coloursteps(even.steps = FALSE)+ )> p4 <- p + scale_fill_binned(guide = guide_coloursteps(show.limits = TRUE))> plot_grid(p1, p2, p3, p4, labels = LETTERS[1:4], ncol = 2)

小果还提供思路设计、定制生信分析、文献思路复现;有需要的小伙伴欢迎直接扫码咨询小果,竭诚为您的科研助力!

定制生信分析
服务器租赁
扫码咨询小果


往期回顾
|
01 |
|
02 |
|
03 |
|
04 |