你的高分文章还差一套WGCNA分析
点击蓝字
关注小图
WGCNA无论在RNA-seq基因表达数据还是GEO数据的分析中都占有不可或缺的位置。小图在项目实战中不少使用该方法来分析基因表达谱。首先我们先了解一下WGCNA是什么吧!
WGCNA(Weighted Gene Co-Expression Network Analysis)称为加权基因共表达网络分析是一种适合进行多样本复杂数据分析的工具,通过计算基因间表达关系,鉴定表达模式相似的基因集合(module),解析基因集合与样品表型之间的联系,绘制基因集合中基因之间的调控网络并鉴定关键调控基因。其适合应用于复杂的多样本转录组数据,是发表转录组高分文章的必备技能。
前天有小伙伴私聊小图,想看看咱们的WGCNA的教程,独乐乐不如众乐乐,于是今天跟大家分享一下小图的代码库,用实际行动证明什么才是真正的“实力宠粉”,一整套WGCNA教程请笑纳。
WGCNA分析,如果你的数据样本较大,建议在服务器中运行!!
想必理论知识小伙伴都看了N遍了,今天小图直接上干货,建议小伙伴边学习边实操!!
Cone on 开始
加载WGCNAR包
#BiocManager::install('WGCNA')library(WGCNA)进行基础设置,(此步骤可以省略)options(stringsAsFactors = FALSE)enableWGCNAThreads() ## 打开多线程
读入数据矩阵
setwd("E:\桌面\5723品种分别做")Data = read.csv("5723-high.csv",row.names=1,quote = "")dim(Data)head(Data)datExpr0 = as.data.frame(t(Data))#转置head(datExpr0[1:5,1:5])
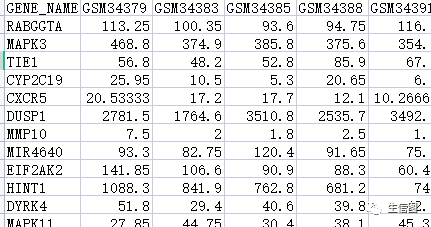
###检测缺失值gsg = goodSamplesGenes(datExpr0, verbose = 3);gsg$allOK ###监测缺失值如果没有缺失返回TRUE,有缺失的话返回FLASE。如果含有过多的缺失值,则对数据集执行下列代码。if (!gsg$allOK){if (sum(!gsg$goodGenes)>0)printFlush(paste("Removing genes:", paste(names(datExpr0)[!gsg$goodGenes], collapse = ", ")));if (sum(!gsg$goodSamples)>0)printFlush(paste("Removing samples:", paste(rownames(datExpr0)[!gsg$goodSamples], collapse = ", ")));datExpr0 = datExpr0[gsg$goodSamples, gsg$goodGenes]}
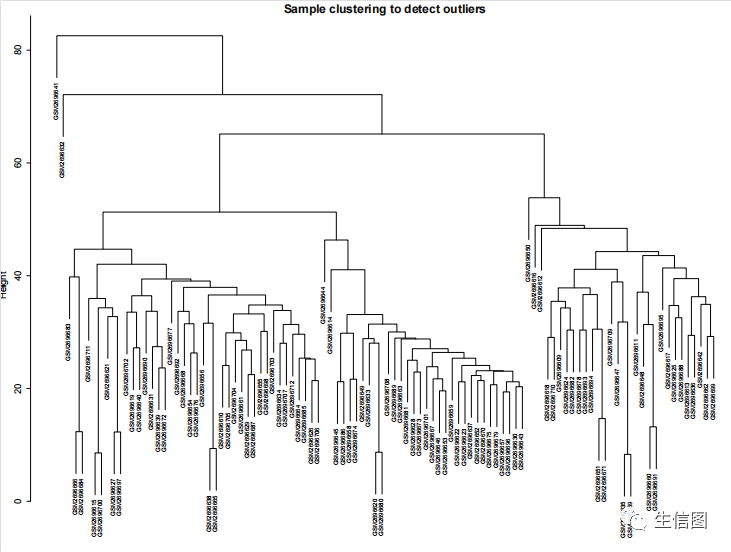
使用聚类的方法,去除离群样本点
sampleTree = hclust(dist(datExpr0), method = "average")sizeGrWindow(12,9)par(cex = 1.2);par(mar = c(0,4,2,0))plot(sampleTree, main = "Sample clustering", sub="", xlab="", cex.lab = 1.5,cex.axis = 1.5, cex.main = 2)datExpr = datExpr0### Plot a line to show the cutdev.off()
选择一个合适的软阈值
powers = c(c(1:10), seq(from = 12, to=30, by=2))sft = pickSoftThreshold(datExpr, powerVector = powers, verbose = 5)计算阈值时间有一丢丢长,等待~永久的等待~sizeGrWindow(9, 5)par(mfrow = c(1,2));cex1 = 0.9;plot(sft$fitIndices[,1], -sign(sft$fitIndices[,3])*sft$fitIndices[,2],xlab="Soft Threshold (power)",ylab="Scale Free Topology Model Fit,signed R^2",type="n",main = paste("Scale independence"));text(sft$fitIndices[,1], -sign(sft$fitIndices[,3])*sft$fitIndices[,2],labels=powers,cex=cex1,col="red");abline(h=0.8,col="red")plot(sft$fitIndices[,1], sft$fitIndices[,5],xlab="Soft Threshold (power)",ylab="Mean Connectivity", type="n",main = paste("Mean connectivity"))text(sft$fitIndices[,1], sft$fitIndices[,5], labels=powers, cex=cex1,col="red")power = sft$powerEstimatepower
关键就是理解pickSoftThreshold函数及其返回的对象,最佳的beta值就是sft$powerEstimate
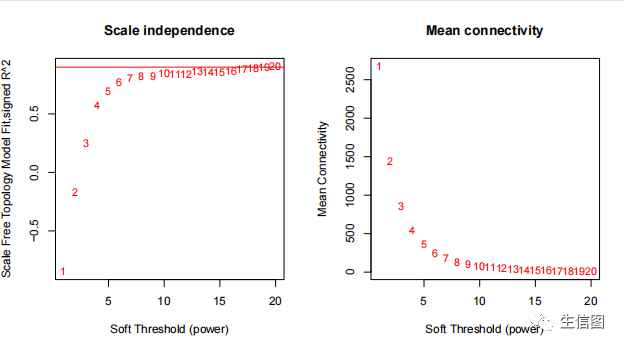
参数beta取值默认是1到30,上述图形的横轴均代表权重参数β,左图纵轴代表对应的网络中log(k)与log(p(k))相关系数的平方。相关系数的平方越高,说明该网络越逼近无网路尺度的分布。右图的纵轴代表对应的基因模块中所有基因邻接函数的均值。最佳的beta值就是sft$powerEstimate。
分步构建网络
softPower = power;adjacency = adjacency(datExpr, power = softPower)
邻接矩阵转换为TOM矩阵
TOM = TOMsimilarity(adjacency);dissTOM = 1-TOM
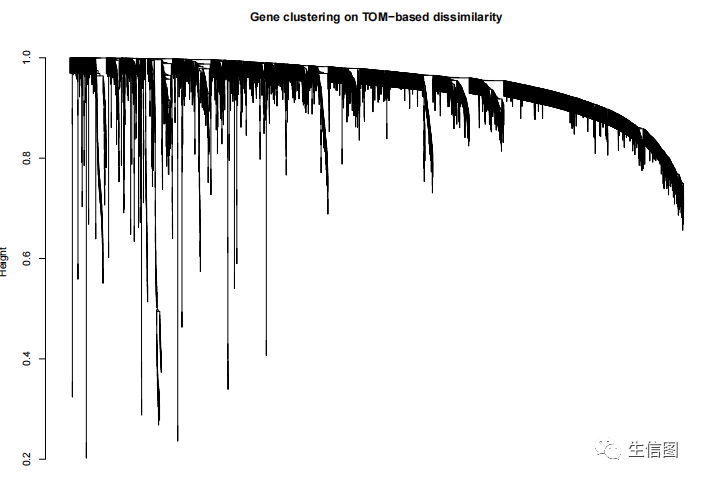
聚类拓扑矩阵
geneTree = hclust(as.dist(dissTOM), method = 'average');plot(geneTree, xlab='', sub='', main = 'Gene clustering on TOM-based dissimilarity',labels = FALSE, hang = 0.04);
聚类分支的休整
minModuleSize = 50;dynamicMods = cutreeDynamic(dendro = geneTree, distM = dissTOM,deepSplit = 2, pamRespectsDendro = FALSE,minClusterSize = minModuleSize);table(dynamicMods)
结果展示
dynamicColors = labels2colors(dynamicMods)table(dynamicColors)sizeGrWindow(8,6)plotDendroAndColors(geneTree, dynamicColors, 'Dynamic Tree Cut',dendroLabels = FALSE, hang = 0.03,addGuide = TRUE, guideHang = 0.05,main = 'Gene dendrogram and module colors')
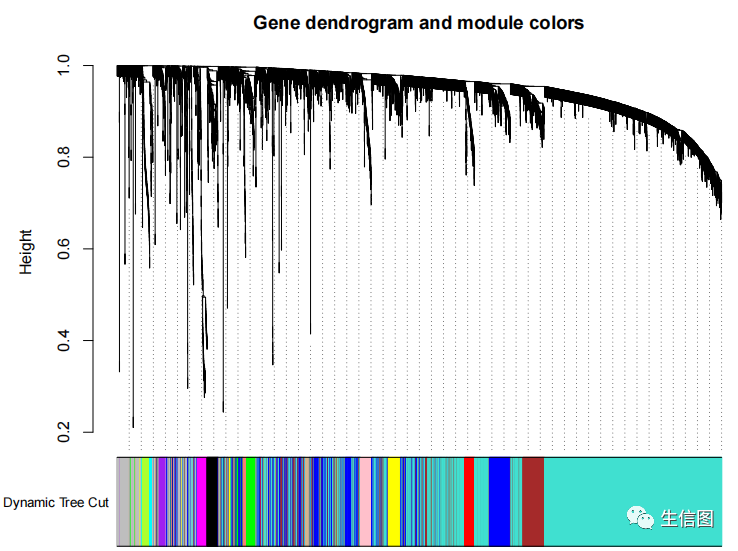
聚类结果相似模块的融合
MEList = moduleEigengenes(datExpr, colors = dynamicColors)MEs = MEList$eigengenesMEDiss = 1-cor(MEs);METree = hclust(as.dist(MEDiss), method = 'average');sizeGrWindow(7, 6)plot(METree, main = 'Clustering of module eigengenes',xlab = '', sub = '')
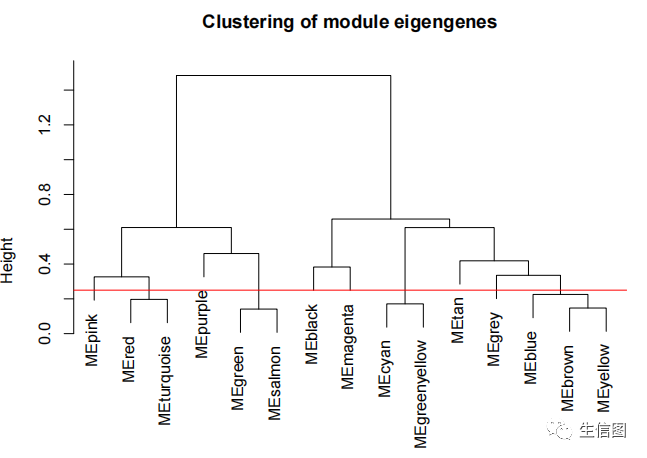
选择有75%相关性的进行融合
MEDissThres = 0.25abline(h=MEDissThres, col = 'red')merge = mergeCloseModules(datExpr, dynamicColors, cutHeight = MEDissThres, verbose = 3)mergedColors = merge$colors;mergedMEs = merge$newMEs;table(mergedColors)##绘制融合前(Dynamic Tree Cut)和融合后(Merged dynamic)的聚类图sizeGrWindow(12, 9)plotDendroAndColors(geneTree, cbind(dynamicColors, mergedColors),c('Dynamic Tree Cut', 'Merged dynamic'),dendroLabels = FALSE, hang = 0.03,addGuide = TRUE, guideHang = 0.05)
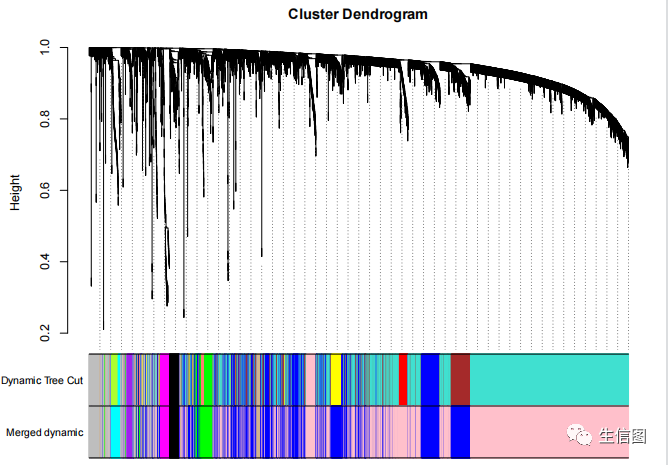
所有的核心就在这一步,把输入的表达矩阵的几千个基因组归类成了几十个模块
只绘制融合后聚类图
plotDendroAndColors(geneTree,mergedColors,'Merged dynamic',dendroLabels = FALSE, hang = 0.03,addGuide = TRUE, guideHang = 0.05)##结果保存moduleColors = mergedColorscolorOrder = c('grey', standardColors(50));moduleLabels = match(moduleColors, colorOrder)-1;MEs = mergedMEs;save(MEs, moduleLabels, moduleColors, geneTree, file = 'stepByStep.RData')
模块和性状的关系
datTraits=read.csv("Traits1.csv",row.names = 1,sep = ",")head(datTraits)
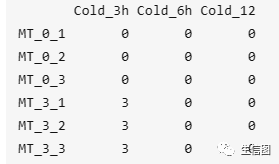
nGenes = ncol(datExpr)nSamples = nrow(datExpr)names(datExpr) = Data$GeneID#每列对应着一个样品row.names(datExpr) = names(Data)#每行对应着一个探针moduleLabelsAutomatic = moduleLabelsmoduleColorsAutomatic = labels2colors(moduleLabelsAutomatic)moduleColorsWW = moduleColorsAutomaticMEs0 = moduleEigengenes(datExpr, moduleColorsWW)$eigengenesMEs= orderMEs(MEs0)modTraitCor = cor(MEs, datTraits, use = "p")colnames(MEs)modlues=MEsmodTraitPvalue = corPvalueStudent(modTraitCor, nSamples)textMatrix = paste(signif(modTraitCor, 2), "n(", signif(modTraitPvalue, 1), ")", sep = "")dim(textMatrix) = dim(modTraitCor)labeledHeatmap(Matrix = modTraitCor, xLabels = colnames(datTraits), yLabels = names(MEs), cex.lab = 0.8, yColorWidth=0.005,xColorWidth = 0.01,ySymbols = colnames(modlues), colorLabels = FALSE, colors = blueWhiteRed(500),textMatrix = textMatrix, setStdMargins = FALSE, cex.text = 0.5, zlim = c(-1,1), main = paste("Module-trait relationships"))
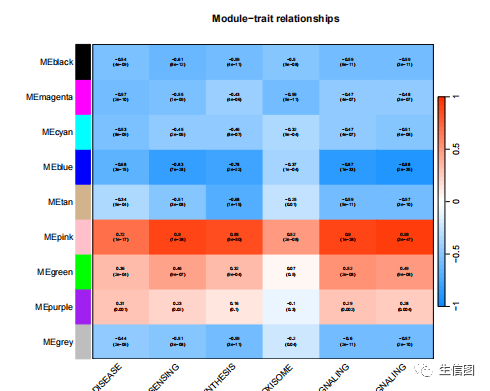
提取模块内的hub genes
printf("hello world!");提取指定模块的基因名,并导出模块
module = "darkred";probes = colnames(datExpr)inModule = (moduleColors==module);modProbes = probes[inModule];head(modProbes)##之后就可以GO分析write.csv(modProbes," gene.csv")
导出模块
TOM = TOMsimilarityFromExpr(datExpr, power = 20);module = "darkred";probes = colnames(datExpr)inModule = (moduleColors==module);modProbes = probes[inModule];modTOM = TOM[inModule, inModule];dimnames(modTOM) = list(modProbes, modProbes)导入visantvis = exportNetworkToVisANT(modTOM,file = paste("VisANTInput-", module, ".txt", sep=""),weighted = TRUE,threshold = 0)head(vis)
以为到此结束了~no no
直接导入cytoscape关键模块进行可视化
导入cytoscape
cyt = exportNetworkToCytoscape(modTOM,edgeFile = paste("CytoscapeInput-edges-", paste(module, collapse="-"), ".txt", sep=""),nodeFile = paste("CytoscapeInput-nodes-", paste(module, collapse="-"), ".txt", sep=""),weighted = TRUE,threshold = 0.2,nodeNames = modProbes,nodeAttr = moduleColors[inModule]
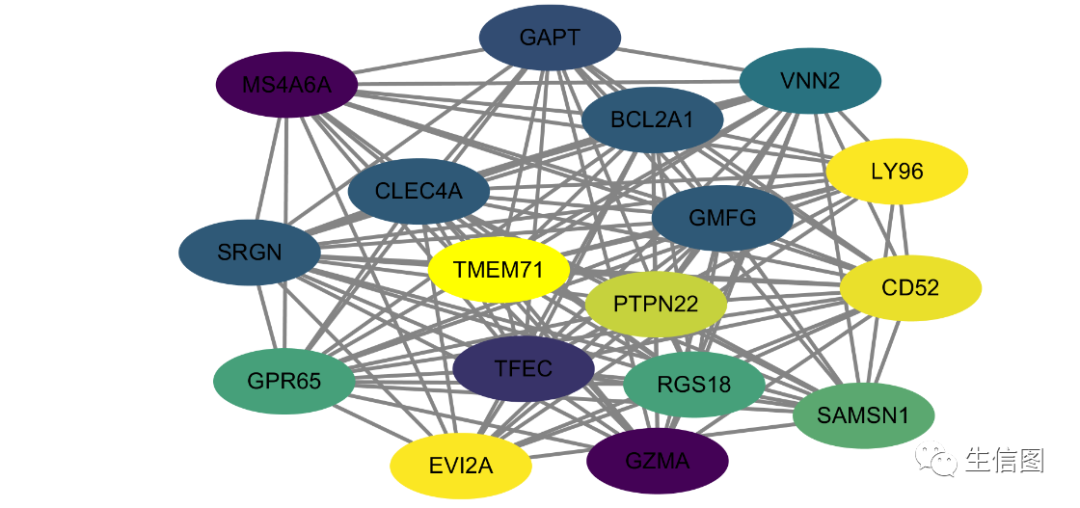
如果模块包含的基因太多,网络太复杂,还可以进行筛选,比如:
nTop =20IMConn = softConnectivity(datExpr[, modProbes])top = (rank(-IMConn) <= nTop)filter <- modTOM[top, top]
后面就是cytoscape的自身操作了,如果有需要和小图说,绝对有“事”必应,小图单独做一期cytoscape使用的详尽介绍。
今天就到这里了。有兴趣的朋友可以继续关注小图的微信公众号(生信图)和云生信生物信息学平台(http://www.biocloudservice.com/home.html)。
欢迎使用:云生信平台 ( http://www.biocloudservice.com/home.html)

|
往期推荐 |
|
|
|
|
|
|
👇点击阅读原文进入网址